In Microsoft, there are two worlds i.e. MS Azure and MS Office 365. They are two two different Active Directories in Microsoft world. Hence, they have their own tools to achieve multiple tasks. And, Data profiling is no exception to this.
In one of our previous articles, we explained the various ways in which you could perform Data Profiling in Azure. We walked through Pandas Profiling, Azure Machine Learning Profiling, and Azure Databricks Profiling. In this one, we will go to the other side i.e. Office 365. And which is the popular Data Analytics tool there? It’s Power BI. In this article, let’s go through Data Profiling in Power BI.
We will use the existing setup using Azure Databricks from the previous data profiling article. However, instead of performing data profiling natively in Databricks, we import that data in Power BI to perform profiling. Here is a high level flow:
- Create a Dataframe from the open California Housing Dataset.
- Save it as a Delta Table
- Connect to Databricks from Power BI and access the delta table.
- Perform Data Profiling in Power BI
Having said that, here is a high level flow:
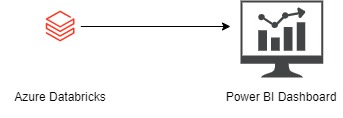
The first two steps are carried out in the Azure Databricks, while the last two are performed by PowerBI. Now, let’s dive hands on.
1. Load California Housing Dataset
Firstly, we load California Housing Dataset in a Pandas Dataframe
import pandas as pd
from sklearn.datasets import fetch_california_housing

california_housing = fetch_california_housing()
pd_df_california_housing = pd.DataFrame(california_housing.data, columns = california_housing.feature_names)
pd_df_california_housing['target'] = pd.Series(california_housing.target)
Secondly, we convert the Pandas Dataframe to Spark Dataframe and write it to Databricks Database as a table.
spark_df_california_housing = spark.createDataFrame(pd_df_california_housing)
spark_df_california_housing.write.mode("overwrite").saveAsTable("tbl_california_housing")
2. Perform Data Profiling in Power BI
Further, once the delta table is created, we go to Power BI for profiling the data. Databricks Delta tables can be accessed directly via. Power BI. To know more, we strongly recommend you to read our article on how to connect Azure Databricks from PowerBI.
Once the connection with the Delta table is established in Power BI, click on Get Data and select Blank Query.
![]()
This opens a new Power Query window. In the expression window, use Table.Profile to perform profiling of the california housing dataset.
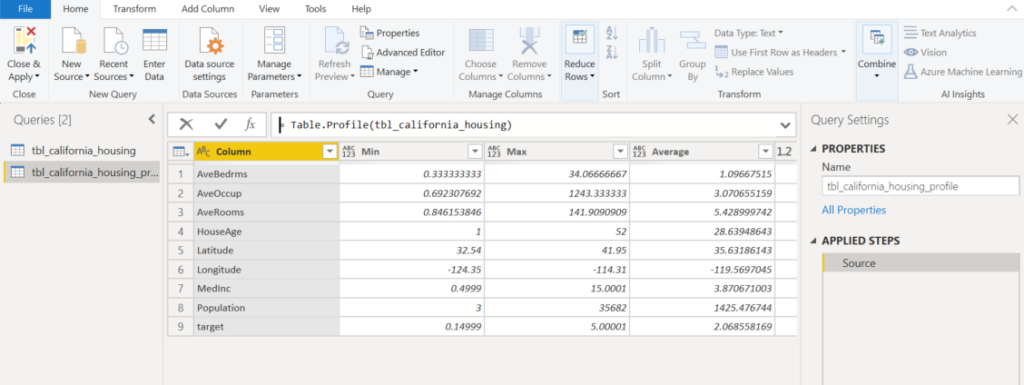
Table.Profile is a Power Query function used to calculate the profiling of a table. It returns the following information about every column (if applicable):
- Min
- Max
- Mean
- Standard Deviation
- Count
- Null Count
- Distinct Count
Nonetheless, to know more about Table.Profile, refer to the Microsoft Docs. Having said that, let’s display the results of table profiling.
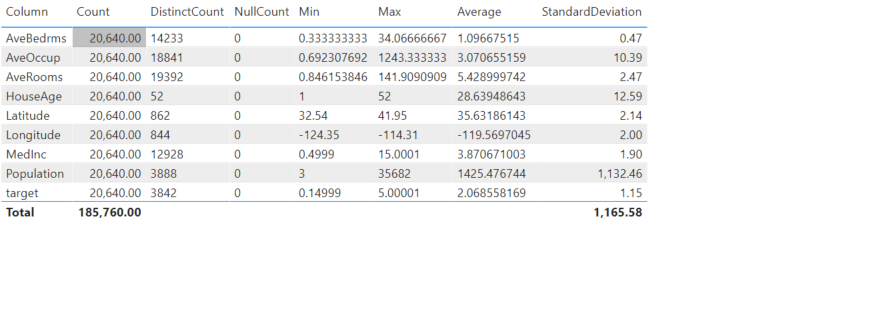
Table.Profile returns the profiling results as a table. To view the profiling results, select a table visual and select all the fields.
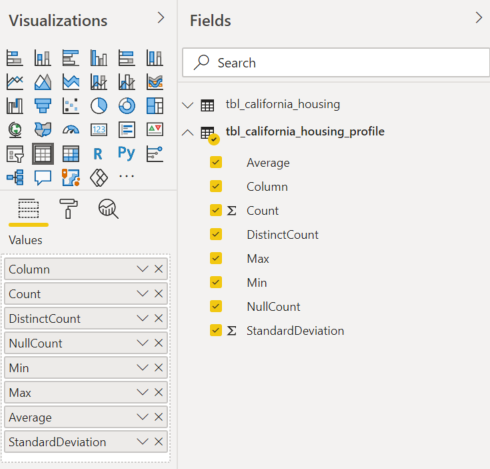
Finally, the result looks like this: