
Microsoft PowerBI is a great tool for Data Visualization. It can connect to a variety of sources. However, databases remain a popular data source. But, what if you want to get the benefits of a database while not connecting to them? Azure Databricks Delta provides this option. To understand delta tables, we recommend you to read: Motivating Databricks Delta in Azure.
In this article, we will use the California Housing Dataset. Let’s get started with the setup. This tutorial has two major steps:
- Delta table and View preparation in Azure Databricks.
- Connecting Azure Databricks Delta to PowerBI and Visualizing the data.
Delta table and View preparation in Azure Databricks.
1. Extract Data
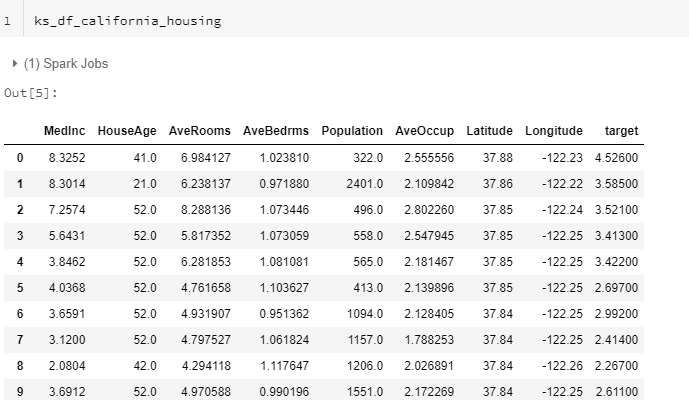
Firstly, let’s extract the California housing dataset in a pandas dataframe and convert it to koalas dataframe.
import pandas as pd
import databricks.koalas as ks
from sklearn.datasets import fetch_california_housing

california_housing = fetch_california_housing(as_frame=True)
pd_df_california_housing = pd.DataFrame(california_housing.data, columns = california_housing.feature_names) pd_df_california_housing['target'] = pd.Series(california_housing.target)
ks_df_california_housing = ks.from_pandas(pd_df_california_housing)
The koalas dataframe looks like this:
2. Save in Delta format.
Next, let’s save the koalas dataframe to delta format.
ks_df_california_housing.to_delta("/mnt/delta/california_housing")
3. Create a delta table on top of it.
Furthermore, let’s create a delta table on top of it.
spark.sql("DROP TABLE IF EXISTS tbl_california_housing")
spark.sql("CREATE TABLE tbl_california_housing USING DELTA LOCATION '/mnt/delta/california_housing'")
spark.sql("Optimize tbl_california_housing")
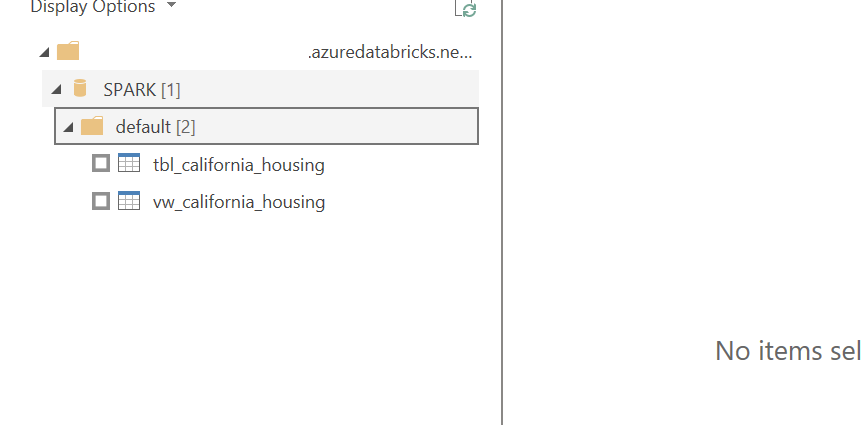
To confirm the existence of the delta table, go to the data>database >default and check if tbl_california_housing exists.
4. Create a view from the delta table
Finally, let’s create the view which calculates the total population by latitude and longitude. It will also comprise a concatenated column named location. Open a new SQL notebook and create a view using tbl_california_housing.
CREATE OR REPLACE VIEW vw_california_housing
AS
SELECT Latitude,Longitude, CONCAT(Latitude,Longitude) as Location, SUM(Population) as Total_Population FROM tbl_california_housing group by Latitude,Longitude
Connecting Azure Databricks Delta to PowerBI and Visualizing the data.
After you are ready with the delta view, follow the below steps on the Power BI desktop.
1. Connect to Azure Databricks Source
Firstly, search for the Azure Databricks source in Power BI

This will open up a window that looks like this:
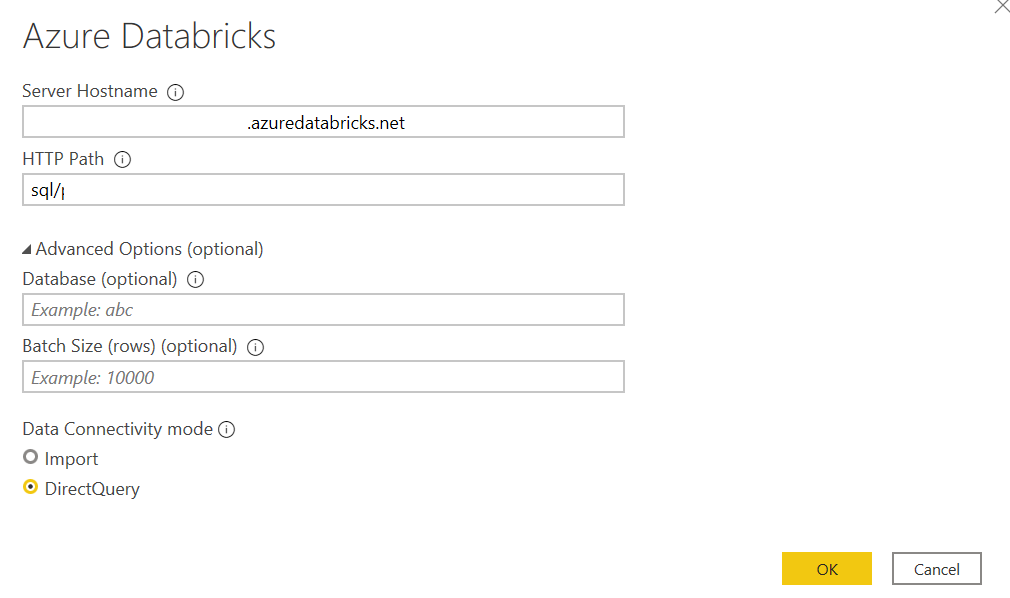
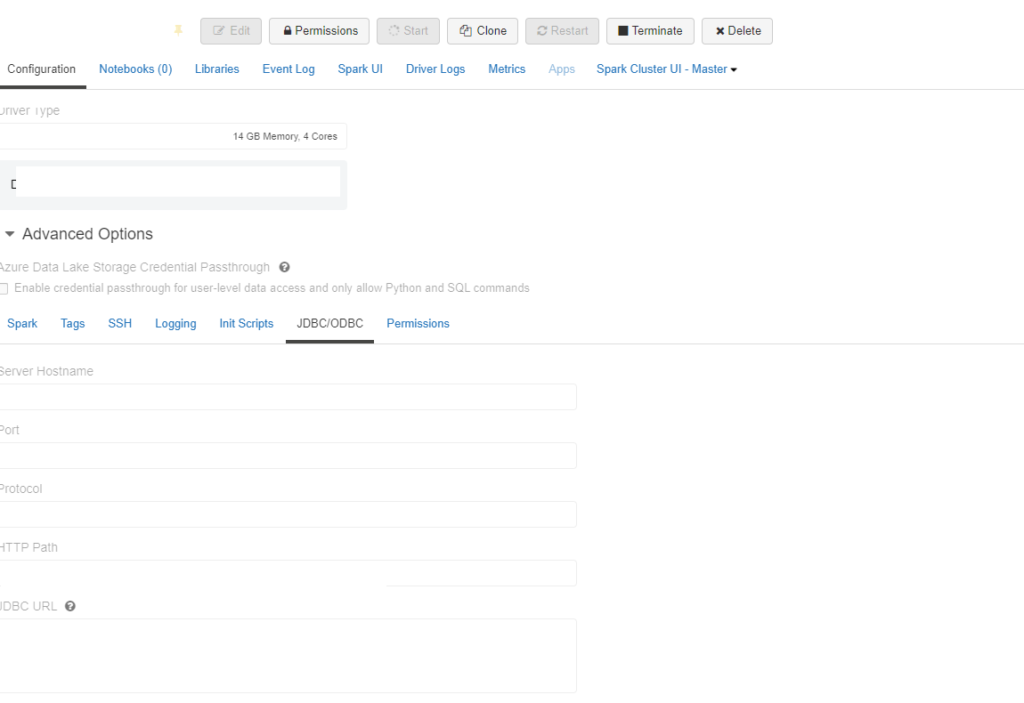
To retrieve Server Hostname and HTTP Path, go to your databricks cluster>Avanced Options>JDBC/ODBC.
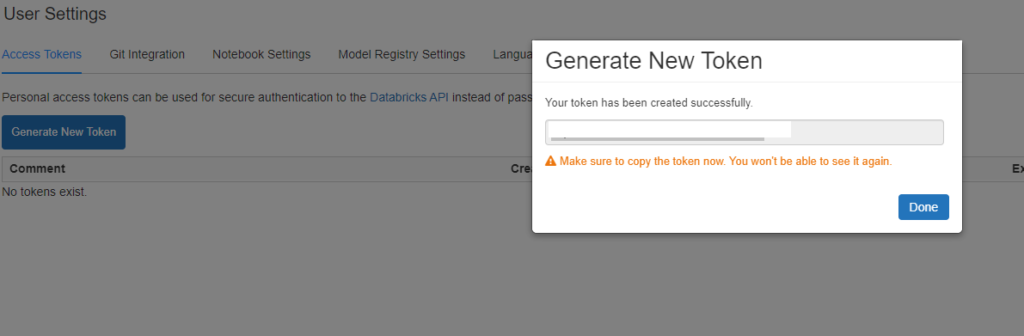
Further, we will use Personal Access Token for authentication. Alternatively, you can use AAD. To retrieve the same, click on User Settings>Generate New Token.

The PowerBI window looks like this:
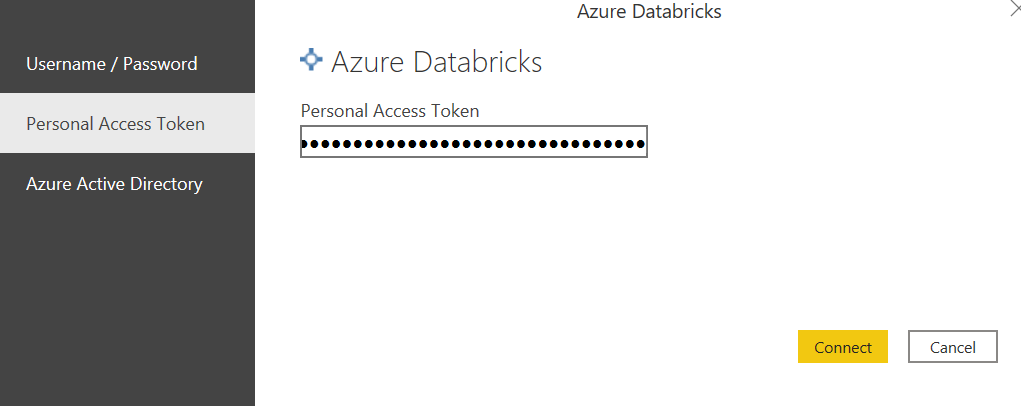
After authentication, select the view:
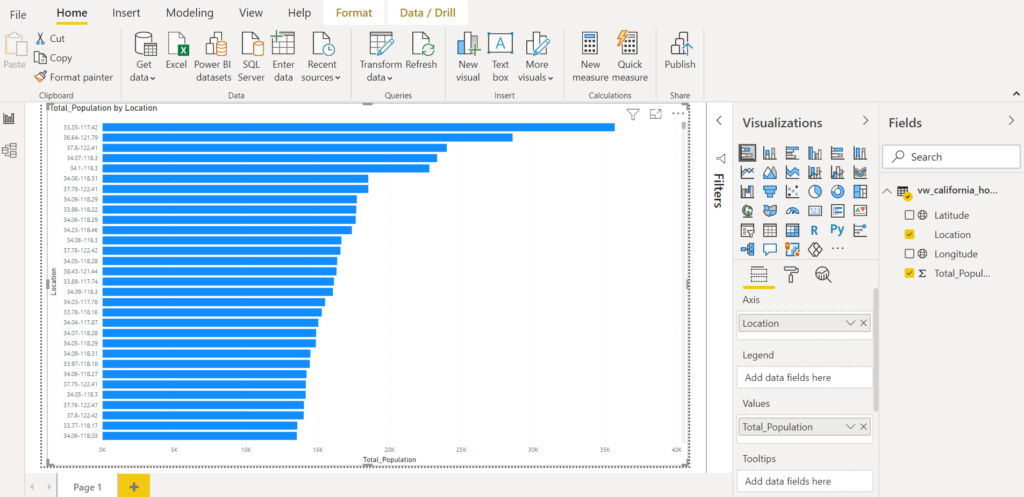
2. Create a bar chart in PowerBI
Subsequently, using the vw_california_housing, let’s plot a bar chart displaying the total population by the location. Moreover, you can change the data formats of Latitude and Longiude.
Conclusion
We hope this tutorial is useful. Note that this is for information. We do not claim any guarantees regarding it’s accuracy and completeness. Read this to know more about Azure Databricks and Power BI.