
Exploratory data analysis entails a lot of ad-hoc analysis. To do so, either they have to rely on databases or file systems like data lakes. Now, to analyze these datasets in spark, they have to load them in memory. In-memory operations are fast. However, they are restricted to a spark session. When the session is terminated, all the computations on raw data are lost and need to be recomputed. Let’s take a scenario.
Imagine you want to analyze averages of weekly data of user behaviour stored in a data lake. What are the steps?
- Load raw weekly data into a dataframe.
- Average the weekly behaviour data.
- Analyze.
Can we reduce this to two? Yes, we can calculate the averages and store it as another file. So now, there are two steps:
- Load Average Data.
- Analyze.
Now, can we reduce this to one step i.e. analyze data? Yes! The answer is Databricks Delta Lake.
What is Databricks Delta Lake?
To put it simply, Databricks Delta Lake uses Databricks File Systems to store delta files and create delta tables. This enables easy exploration and querying of data using SQL for Data Scientists.
To enable data scientists/analysts to do so, the following steps need to be performed:
- Extract Data.
- Save it in delta format.
- Create a delta table on top of it.
Let’s demonstrate this using California housing dataset.
1. Extract Data
Firstly, let’s extract the California housing dataset in a pandas dataframe and convert it to koalas dataframe. If you don’t know what’s koalas dataframe, read this article: Databricks Koalas: bridge between pandas and spark.
import pandas as pd
import databricks.koalas as ks
from sklearn.datasets import fetch_california_housing

california_housing = fetch_california_housing(as_frame=True)
Next, convert this to pandas dataframe:
pd_df_california_housing = pd.DataFrame(california_housing.data, columns = california_housing.feature_names)
pd_df_california_housing['target'] = pd.Series(california_housing.target)
Lastly, let’s convert it to koalas dataframe:
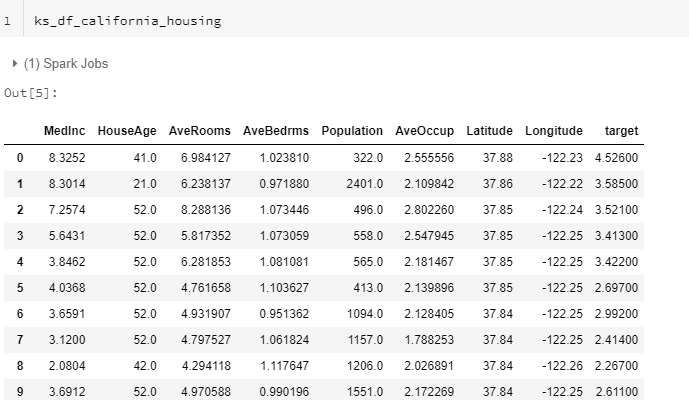
ks_df_california_housing = ks.from_pandas(pd_df_california_housing)
The koalas dataframe looks like this:
2. Save in Delta format.
Furthermore, imagine a scenario where we want to have the total population by Latitude and Longitude. So, let’s save the koalas dataframe to delta format.
ks_df_california_housing.to_delta("/mnt/delta/california_housing")
3.Create a delta table on top of it.
Lastly, let’s create a delta table on top of it.
spark.sql("DROP TABLE IF EXISTS tbl_california_housing")
spark.sql("CREATE TABLE tbl_california_housing USING DELTA LOCATION '/mnt/delta/california_housing'")
spark.sql("Optimize tbl_california_housing")
To confirm the existence of delta table, go to the data>database >default and check if tbl_california_housing exists.
Query Databricks Delta Table
Now, whenever the data scientists/analysts want to query the databricks delta table, they can open a new SQL notebook and query tbl_california_housing straightaway!
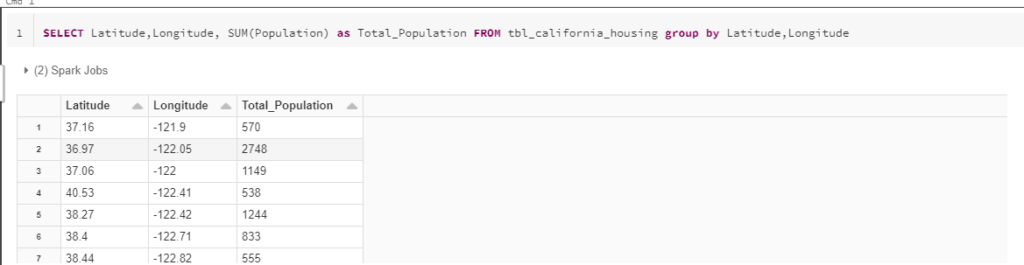
They don’t need to load it, create a view on top of it. Moreover, the Optimize command above fastens the query. Here is the query:
SELECT Latitude,Longitude, SUM(Population) as Total_Population FROM tbl_california_housing group by Latitude,Longitude
Conclusion
In conclusion, databricks delta lake is like a database on spark. We recommend you to try this simple exercise for yourself. Please note that this is for information purpose and not exhaustive. More articles will come up on this topic.
P.C. Github