We can solve every problem in multiple ways. In our previous article, we motivated the need to fit cumulative distributions. Moreover, we demonstrated the same in Azure Databricks using PySpark.
We strongly urge you to read that article Cumulative Distribution in Azure Databricks.
However–at the cost of repeating myself– we can solve a problem in multiple ways. In this article, we fit a cumulative distribution in Azure Databricks using Spark SQL. There two reasons why we are covering this separately:
- Even though the world us moving towards Big data, the importance of SQL has not diminished.
- No everyone working on platforms like spark are conversant with PySpark. That is the reason why Spark SQL is so popular.
In our previous article, we used the concept of “window functions” in Spark SQL. The windows help us specify the group and order by which want to apply our aggregation/ analytical function. With SQL, we remove this step in fitting the cumulative distribution. Instead, we achieve it using the over() clause in the same.
Let us get hands-on with Spark SQL. Please note that we will be using the same example used in our previous article mentioned above. To give you a brief overview of the same, we tried to find the average of the top quantile values of a column, grouped by a given column.
Step 1: Create a Dataset
Since we are building on an existing example, this step is like the one mentioned in the aforementioned article. In real-world, however, you will have data in your information systems like databases/data lakes. Nonetheless, here is the code to create a toy dataframe in spark.
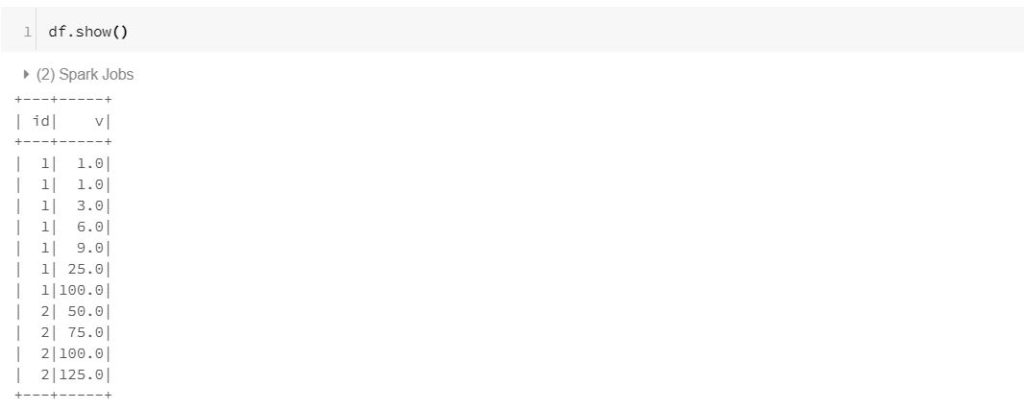
In this dataset, we have two columns id and v. The column ‘v’ consists of the values over which we need to fit a cumulative distribution. Moreover, we will fit the distribution by grouping the values ‘v’ by an id column.
df = spark.createDataFrame(
[(1, 1.0),(1, 1.0), (1, 3.0), (1, 6.0), (1, 9.0),(1, 25.0),(1, 100.0),(2,50.0),(2,75.0),(2,100.0),(2,125.0)],
("id", "v"))
Step 2: Create a view
This the step that marks the difference between the two approaches. In PySpark, we create a window. However, in spark, we cannot write SQL queries on the dataframes directly. Hence, we create a temp view on top of it.
df.createOrReplaceTempView("tbl_df")
With tbl_df, we can fire SQL queries in spark. Please note that Spark SQL has its odd differences with its other flavours.
Step 3: Fitting the CDF using Spark SQL
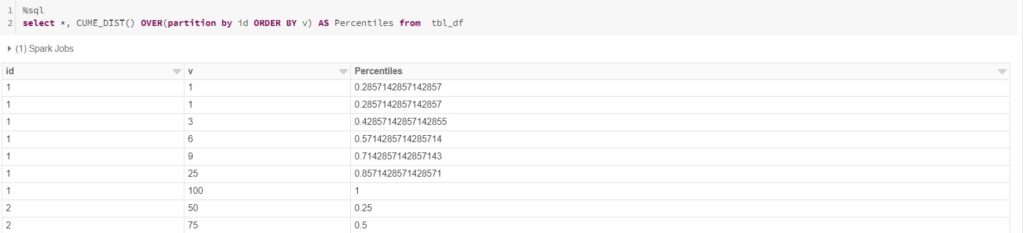
Now, comes the most important and interesting part i.e. fitting the cumulative distribution. Here we use the CUME_DIST() SQL function. Please note that we are demonstrating this in Spark SQL for continuity. Otherwise, this function can be used in other flavours of SQL like T-SQL. Moreover, it can be used in MS SQl Server, Azure SQL Database and Azure Synapse Analytics. To know more about this function, refer to this link.
Nonetheless, coming back, as we mentioned earlier, we don’t need window functions in SQL. Instead, we use the Over clause of SQL to fit the cumulative distribution, as shown below.
%sql
select *, CUME_DIST() OVER(partition by id ORDER BY v) AS Percentiles from tbl_df
On a side note, the %sql is the feature of databricks, where you can switch to SQL language within the same notebook. Coming back to the topic, we can see the percentiles in the below snapshot.
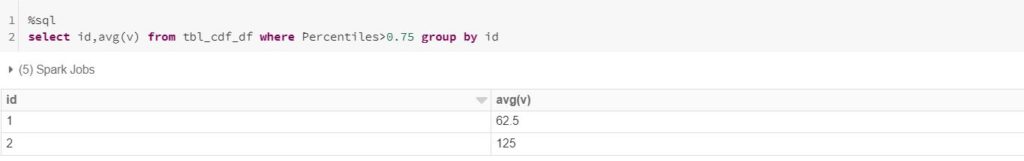
Step 4: Top Quantile Average.
Now, in order to get the top quantile averages, we need to filter all the rows with percentile values above 75. In order to do that we need to create a spark dataframe from the above query. In SQL we can do the same by using the ‘select * into from table’ from a query. In Spark, we can do that using spark.sql.
sql_query = "select *, CUME_DIST() OVER(partition by id ORDER BY v) AS Percentiles from tbl_df"
df_cdf = spark.sql(sql_query)
df_cdf.createOrReplaceTempView("tbl_cdf_df")
After this filter the above table “tbl_cdf_df” for values above 75th percentile.
%sql
select id,avg(v) from tbl_cdf_df where Percentiles>0.75 group by id
Conclusion
We hope that you find this article useful. Please note that this is only for information purposes. We don’t claim it’s completeness. Kindly try it for yourself before adopting it.
P.C. By Chen-Pan Liao – Own work, CC BY-SA 3.0, https://commons.wikimedia.org/w/index.php?curid=27516844