This is the age of AI. Hence, you want to automate a certain business process, let’s say, for instance, email classification. So, you have built a Machine Learning model. The metrics look great and business users are happy. Now what?
You decide that it’s time to go live with the model. Hence, you get the infrastructure ready and deploy your machine learning model. It has an endpoint that receives email messages to be scored against your model. In the beginning, everyone is happy, since automation has kicked in. But shortly, you receive complaints about the misclassification. Over time, the numbers grow and you wonder what may have gone wrong. What is causing the drift from the expected performance? Most probably, it is ‘Drift’ in Machine Learning Models.
Concept vs Data Drift
They made machine learning algorithms to model uncertainties of the actual world. Thus, they change. They call this dynamic nature of ML models is Drift. Drift in Machine Learning occurs in two forms: concept drift and data drift.
Concept drift happens when a new business scenario emerges, which was non-existent in the model building process. It is likely that users change their behaviour over time, thus causing new patterns to emerge. In simple words, the relationship between X and y changes. An example of this could be users using their credit cards excessively in the face of a black swan event like COVID-19. In the email classification example, a new category may come up.
As far as Data drift is concerned, it results from changing Features, which is typically unseen in the Modeling Phase. For instance, in the email classification example, people may use synonyms of a word from the dictionary. In simpler term, here X changes. This may happen because of either a non-stationary environment or, in a big data scenario, the training data is not representative of the population.
Data Drift in Azure Machine Learning
Having learnt what is Data Drift and Concept Drift, wouldn’t it be great if we can detect the same? Fortunately, with the democratization of Machine Learning, we have tools at our disposal to ease our life. One of them is Azure Machine Learning. So, how useful is Azure Machine Learning in detecting Drift? We found no way to detect concept drift. However, we have a way to detect data drift.
Setting up
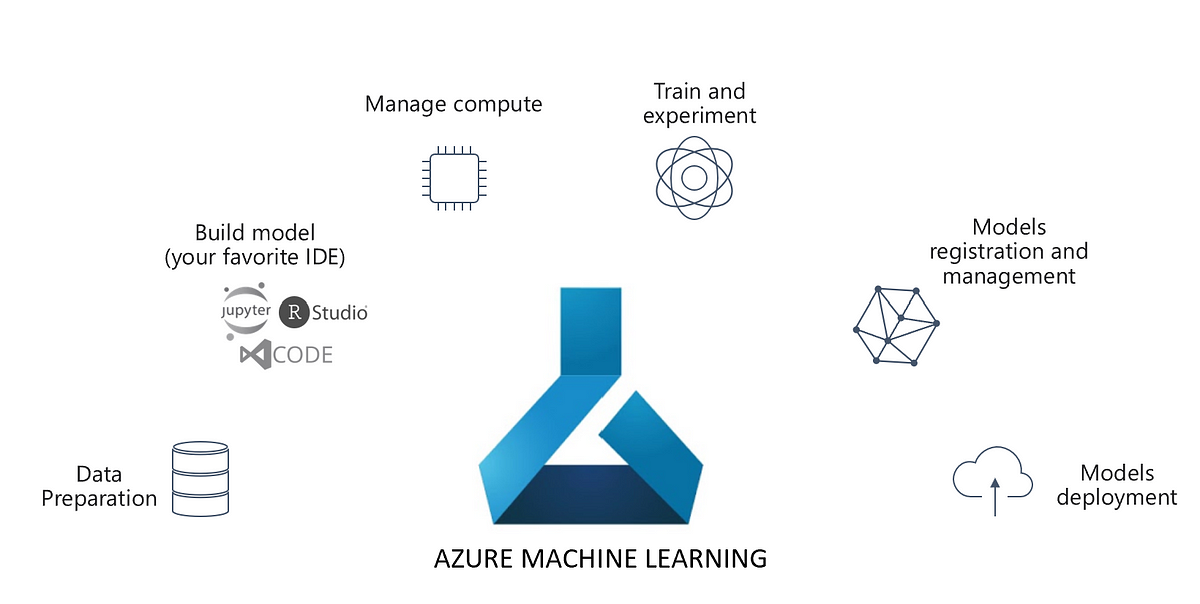
We assume you are familiar with Azure Machine Learning. If not, refer to this link. Azure Machine Learning is Microsoft Azure’s flagship ML as a service platform for training, deployment, orchestration, monitoring Machine Learning models. In this article, we will focus on the monitoring aspect of ML.
One feature of Azure Machine Learning is the Azure ML SDK, which is a custom python library by Microsoft. It comprises a library called azureml-datadrift.
But, before that, let’s perform some housekeeping. Assuming that you have created an AML workspace, first create a compute. You can either use a CLI or the Azure ML studio. To create your compute, refer to this link.
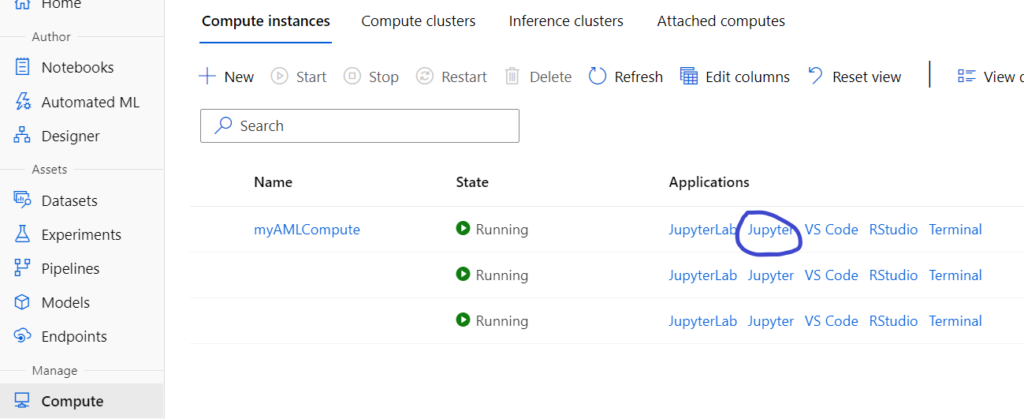
After creating the compute, click on Jupyter. It will open a Jupyter environment.
Next, create your folder and open a terminal to clone this git repository. For detailed instructions, refer to this link.
Creating baseline dataset
Once you are ready with the setup, navigate to the folder in which you have cloned the above repository and open notebook 17 – Monitor Data Drift.
The first step checks for the azureml-datadrift library.
!pip show azureml-datadrift
Next, connect to the Azure ML workspace using the following script.
from azureml.core import Workspace

# Load the workspace from the saved config file
ws = Workspace.from_config()
print('Ready to work with', ws.name)
Now, comes the important step of creating a dataset. A dataset is like a data view created from a datastore. A datastore is a linked service or a connection to any data source like Azure Blob store, Azure SQL DB, Azure Data Lake store, etc. To read more about it, read this link on datastores.
We can create datasets using either code or studio. We will use the former.
Here, the toy data diabetes is in the data folder of the cloned repository. We will create a dataset using this data.
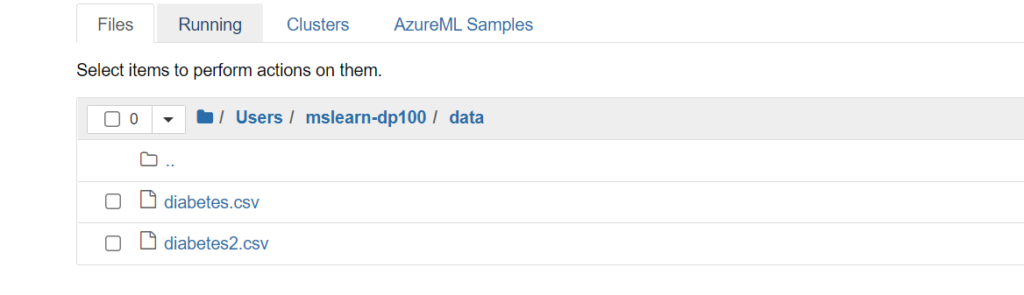
The next script will create a data set using the two files. First, it will upload the data to the workspace blob store and create a view on top of it.
from azureml.core import Datastore, Dataset

# Upload the baseline data
default_ds = ws.get_default_datastore()
default_ds.upload_files(files=['./data/diabetes.csv', './data/diabetes2.csv'],
target_path='diabetes-baseline',
overwrite=True,
show_progress=True)

# Create and register the baseline dataset
print('Registering baseline dataset...')
baseline_data_set = Dataset.Tabular.from_delimited_files(path=(default_ds, 'diabetes-baseline/*.csv'))
baseline_data_set = baseline_data_set. register(workspace=ws,
name='diabetes baseline',
description='diabetes baseline data',
tags = {'format':'CSV'},
create_new_version=True)

print('Baseline dataset registered!')
This creates our baseline dataset.
Creating Target dataset
For simulation, we will create a target dataset and add certain drift to the data week over week for the past 7 weeks. Fundamentally, you create a time series dataset using this method. Below is the code to do the same.
import datetime as dt
import pandas as pd

print('Generating simulated data...')

# Load the smaller of the two data files
data = pd.read_csv('data/diabetes2.csv')

# We'll generate data for the past 6 weeks
weeknos = reversed(range(6))

file_paths = []
for weekno in weeknos:

    # Get the date X weeks ago
    data_date = dt.date.today() - dt.timedelta(weeks=weekno)

    # Modify data to create some drift
    data['Pregnancies'] = data['Pregnancies'] + 1
    data['Age'] = round(data['Age'] * 1.2).astype(int)
    data['BMI'] = data['BMI'] * 1.1

    # Save the file with the date encoded in the filename
    file_path = 'data/diabetes_{}.csv'.format(data_date.strftime("%Y-%m-%d"))
    data.to_csv(file_path)
    file_paths.append(file_path)

# Upload the files
path_on_datastore = 'diabetes-target'
default_ds.upload_files(files=file_paths,
target_path=path_on_datastore,
overwrite=True,
show_progress=True)

# Use the folder partition format to define a dataset with a 'date' timestamp column
partition_format = path_on_datastore + '/diabetes_{date:yyyy-MM-dd}.csv'
target_data_set = Dataset.Tabular.from_delimited_files(path=(default_ds, path_on_datastore + '/*.csv'),
partition_format=partition_format)

# Register the target dataset
print('Registering target dataset...')
target_data_set = target_data_set.with_timestamp_columns('date').register(workspace=ws,
name='diabetes target',
description='diabetes target data',
tags = {'format':'CSV'},
create_new_version=True)

print('Target dataset registered!')
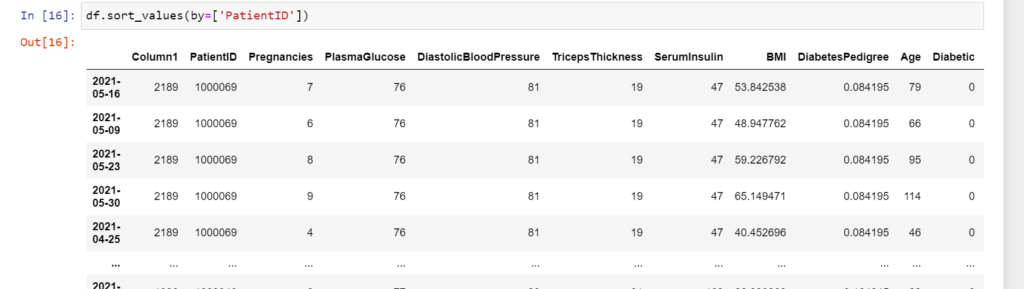
To check how the target dataset looks like, convert it into Pandas Dataframe.
df = target_data_set.to_pandas_dataframe()
Creating a Data Drift Monitor
Before creating a Data Drift Monitor, create a compute cluster and connect to it using the following code:
from azureml.core.compute import ComputeTarget, AmlCompute
from azureml.core.compute_target import ComputeTargetException

cluster_name = "<your-cluster-name>"

try:
   # Check for existing compute target
   training_cluster = ComputeTarget(workspace=ws, name=cluster_name)
   print('Found existing cluster, use it.')
except ComputeTargetException:
   # If it doesn't already exist, create it
try:
   compute_config = AmlCompute.provisioning_configuration(vm_size='STANDARD_DS11_V2', max_nodes=2)
   training_cluster = ComputeTarget.create(ws, cluster_name, compute_config)
   training_cluster.wait_for_completion(show_output=True)
except Exception as ex:
   print(ex)
Next, create a data drift monitor. This specifies the baseline and target dataset to be compared along with properties like frequency of monitoring, compute cluster, feature list, etc.
from azureml.datadrift import DataDriftDetector

# set up feature list
features = ['Pregnancies', 'Age', 'BMI']

# set up data drift detector
monitor = DataDriftDetector.create_from_datasets(ws, 'mslearn-diabates-drift', baseline_data_set, target_data_set,
          compute_target=cluster_name,
          frequency='Week',
          feature_list=features,
          drift_threshold=.3,
         latency=24)
monitor
Backfill the Data Drift Monitor
Now, in order to analyze data drift trends over time, you need to find a backfill job from your data drift monitor. This backfill job run will analyze how data has drifted over a time frame. The backfill function takes start date and end date as parameters and uses the time series data created above to generate the drift analysis.
from azureml.widgets import RunDetails

backfill = monitor.backfill(dt.datetime.now() - dt.timedelta(weeks=6), dt.datetime.now())

RunDetails(backfill).show()
backfill.wait_for_completion()
Finally, after running the backfill job, Analyze the data drift:
drift_metrics = backfill.get_metrics()
for metric in drift_metrics:
    print(metric, drift_metrics[metric])
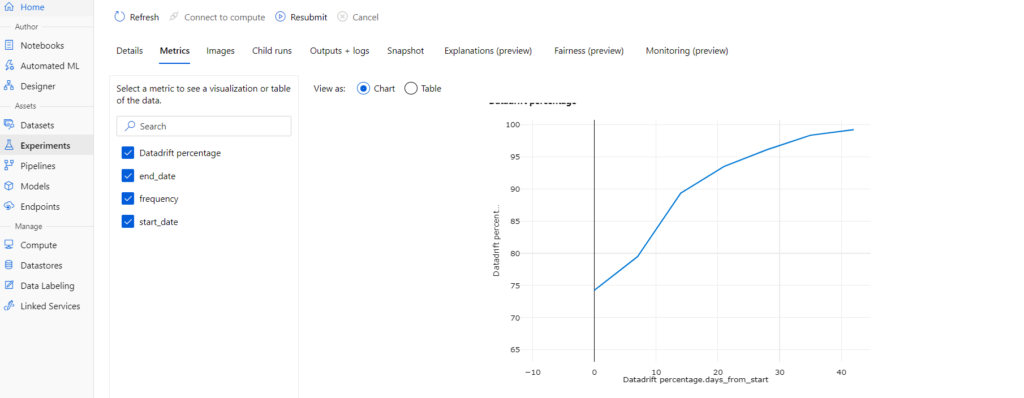
However, you can view a graphical representation of the backfill run in Azure ML studio.

Conclusion
Hope you find this article helpful. This is only for information. We do not claim any guarantees whatsoever.
Also read: The Azure Machine Learning Designer
Note. All the code has been sourced from the Github link mentioned in the article.