
Prologue to Analytics with Python
I strongly recommend reading this article before you go ahead with this article: Log Analytics using STRING_SPLIT function. This article introduced Log Analytics using SQL. However, with the evolution of Data Engineering and Analytics, Python has emerged to be a primary choice of language for analytics and Log Analysis is no exception. However, since the fundamental principles remain the same, any language which tends to overtake its predecessor, should possess equivalents from the same.
In the above-mentioned article, we perform Log analytics using the following steps:
- Extract and Load the data.
- Using String_Split() SQL function to split the data.
- Data Cleansing and Transformation.
We will adopt a similar approach using python. Let us try to analyse logs using the Python Pandas Dataframe.
The Pandas Dataframe
We are aware of the fact that SQL is a query language primarily used for tabular data analysis. Hence, in the first place, we need an equivalent of a table in Python (or any other language like R). That equivalent is a dataframe. Dataframes are based on the concept of Statistical tables, consisting of rows and columns. Furthermore, they contain metadata information like row names and column names. For more on Dataframes, please read this article.
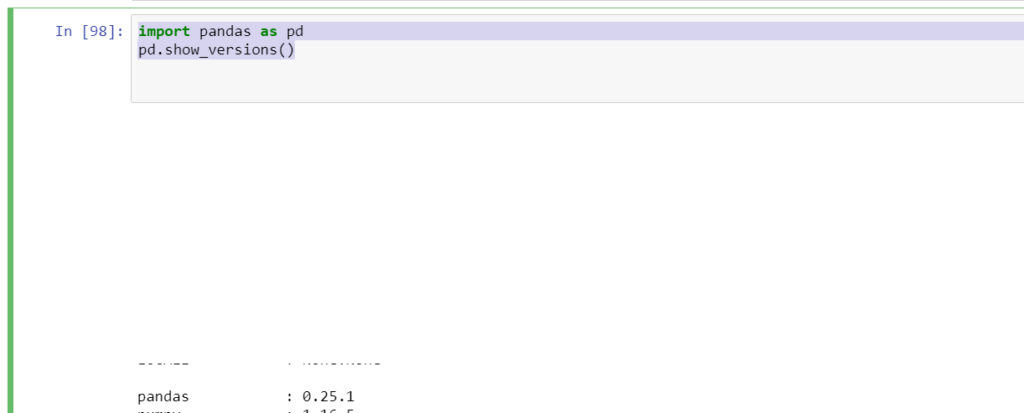
In Python, dataframes are a part of it’s most famous data manipulation library, the Pandas. We will be using the latest release of Pandas (v0.25.1) in this article since a lot of new functions have been incorporated in this release. Let us walk through the steps to achieve our objective of Log analytics with python pandas dataframe.
Pre Requisite Setup
I will assume that you have Python 3.6+ installed on your system along with the Anaconda distribution if you intend to use the jupyter notebook. Once, you are ready with the setup, open the command prompt and install pandas, using the following command. This will make sure that you have the latest version of pandas on your machine.
pip3 install pandas
Next, open your Jupyter notebook from the Anaconda prompt, using the following command.
jupyter notebook
Further, upgrade the pandas in your Jupyter Notebook, to keep your notebook server in sync with the latest release of Pandas.
pip install --upgrade pandas
Lastly, import your ‘pandas’ library and check the version.
import pandas as pd
pd.show_versions()
Log Analytics with Python
I assume that we are ready with the setup. Now, let us go ahead and perform log analytics with python pandas dataframe.
Step 1: Getting the data
In this article, we won’t be using the actual log data, but simulate it. The below python script will add some dummy data to a dataframe.
df = pd.DataFrame({ 'key':['1','2','3'], 'values':['a,b,c','d,e,f','p,q,r']})
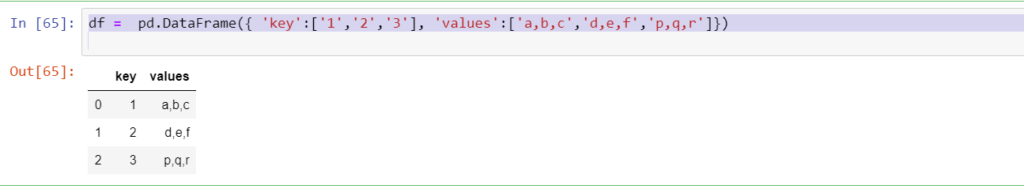
Please note that the column ‘values’ contains data which is similar to logs i.e. information separated by a character. This type of data occurs in many instances. Hence, in order to analyse them, we need to split those values effectively.
Step 2: Using Pandas 0.25.1 explode
Next, we need to split the comma-separated log-like values into different cells. Here is where the new function of pandas 0.25 explode comes into the picture. The below code illustrates the use of the explode function beautifully.
explode_df=df.assign(values= df['values'].str.split(',')).explode('values').reset_index(drop=True)
Let us try to understand each and every function used here.
Assign
The first function is ‘assign‘. The assign method can be understood as a function to assign new values to old existing columns or creating a new column. In this case, we will override the existing column named as ‘values’ with new values. This brings us to the next function i.e. str.split.
str.split
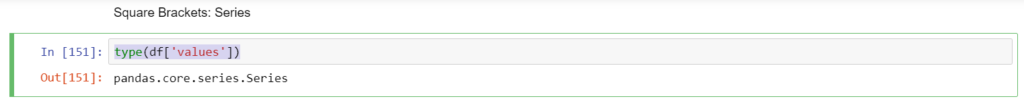
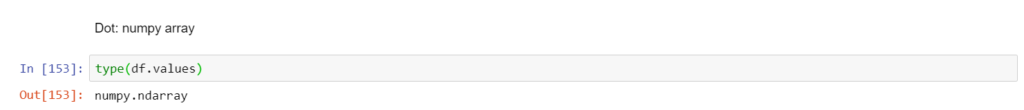
The explode method works on a list/list-like object. The str.split method will help us convert every element of the column ‘values’ into a list. Please note that we need to use the square bracket notation to access ‘values’ from df, in order to use str.split since, the dot notation returns a numpy array.
type(df['values'])
type(df.values)
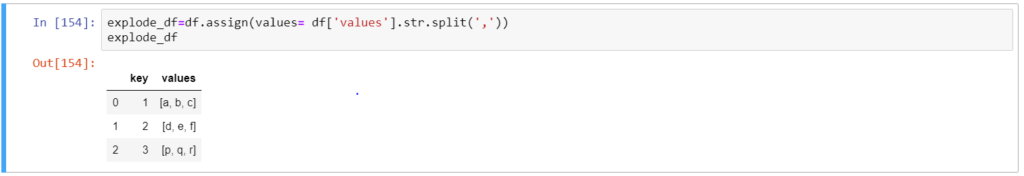
Thus, after using the assign along with str.split, we get the following result.
explode
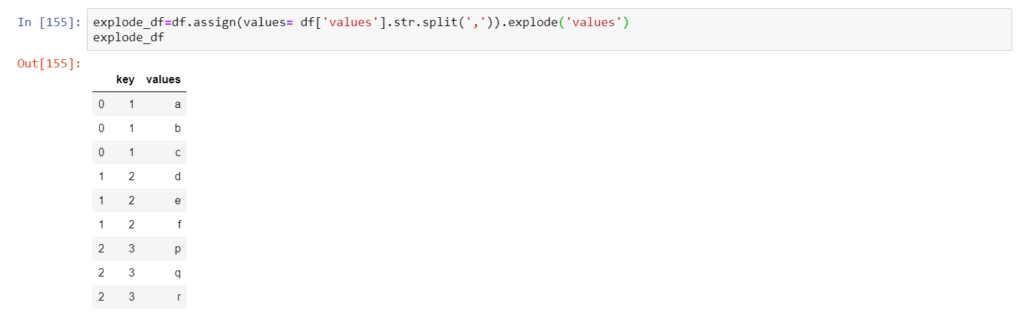
Now comes the focal point of this topic, the explode method. The explode method transforms every element of a list into a row. This is similar to string_split() function in SQL. The result of explode function can be seen below.
reset_index
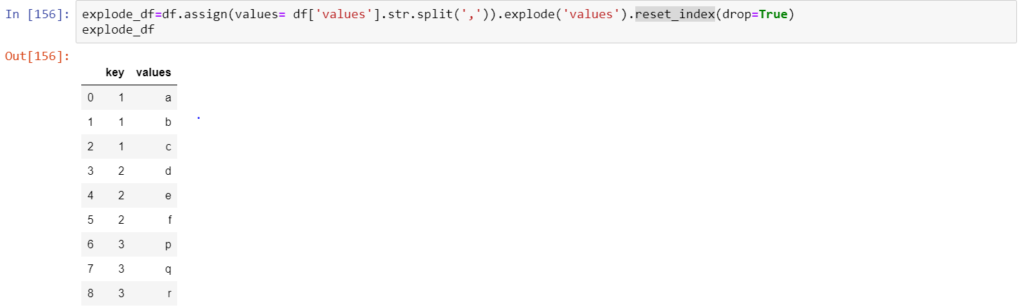
However, we can observe that the indices to the rows (extreme left of the dataframe) contain repeated values. Hence, in order to have an identity column as an index, while removing the existing index, we use the reset_index method. Moreover, this step helps us to use the pivot function, which we will walk through in a while. The parameter ‘drop=True’ ensures that the existing index is dropped while a new column is created. The final result of ‘explode’ with reset_index looks like this.
Step 3: Using Pivot
This step is an optional transformation which can be performed in order to use the ‘key’ as columns whereas the values are it’s column values. We use the built-in pivot function for the same.
pivot_df= explode_df.pivot(columns='key', values='values')
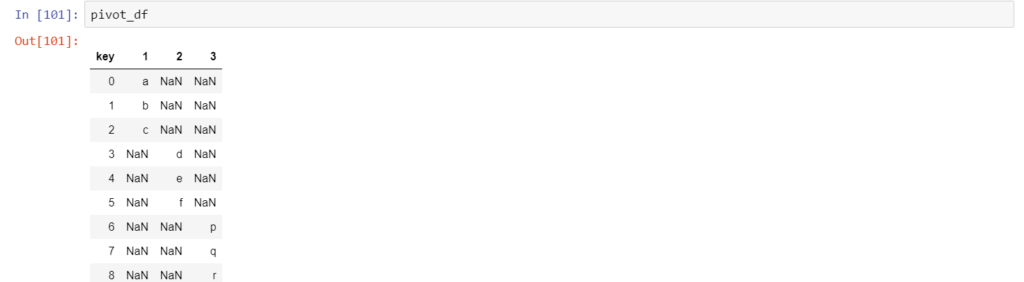
Please note that we get these undesired NaN values as well. However, we have methods which can effectively deal with these values.
Conclusion
Imagine the column ‘values’ contained sales for a region and we would like to have the sales for a region in one column, this method of ‘explode’ can be very useful to get those list values in individual cells. Let me be explicit that this is not the only way to analyse logs. There could be many ways to achieve the same and we encourage you to explore more and share it.