Motivating Azure IoT
Before we dive into Azure IoT, we need to understand the significance of IoT. There was a time when the word ‘interaction’ was restricted to humans. Gradually, computers started interacting, leading to the explosion of the Internet. Finally, we have reached a point where ‘devices’ interact with each other, ushering in the era of the Internet of Things or IoT. Predictive maintenance has been one of the most important applications of IoT, owing to interactivity between devices, faster computing, etc. This has enabled faster decision making.
As Charles Darwin says, “It is not the strongest of the species that survives, nor the most intelligent that survives. It is the one that is most adaptable to change”, the ability to sense changes quickly enhances decision making. The power to predict a breakdown or a disaster soon is a great asset to any organisation and this use case is called predictive maintenance.
However, in order to get near-real-time predictions, we have to feed the predictive model with real-time data, thus leading to the design and creation of real-time pipelines in the lambda architecture.
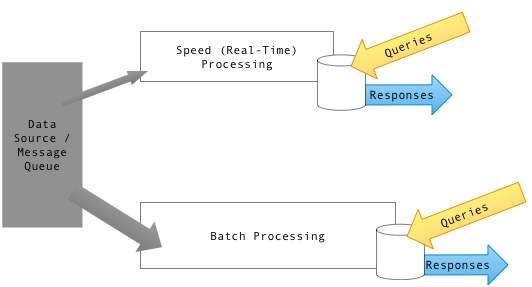
Lambda architecture.
Real-time architecture in Azure
In the real world, devices emit enormous volumes of data at very high speeds. Building traditional on-premises systems for such requirements involves enormous costs and efforts. Fortunately, various fully managed cloud technologies (including Microsoft Azure) can take care of high volumes and speeds.
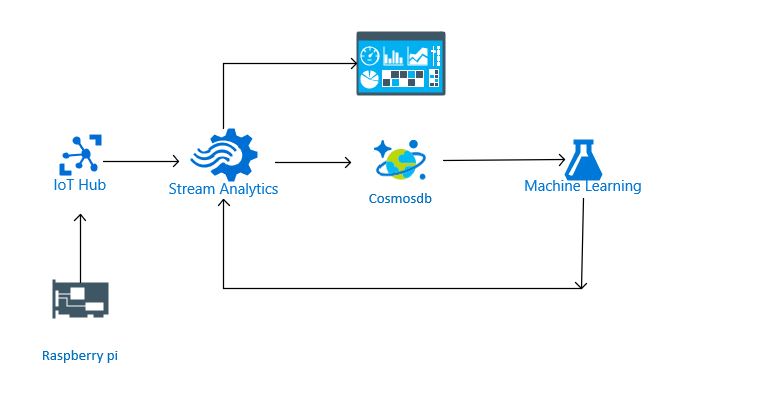
Firstly, we need a messaging service or hub that acts as an interface between your IoT application and the devices. IoT hub, a Platform as a Service offering from Microsoft Azure is the message service or between the devices and the cloud. It receives events from devices and sends them to an event processing engine like Azure Stream Analytics.
Once the events are processed by stream analytics, we can either visualize the streaming data in a visual layer like Power BI or persist it in a database layer. CosmosDB will be used for the latter since it has a two-fold advantage of unlimited memory and NoSQL support. Historical data stored in Cosmos db is used to train an anomaly detection model in order to detect anomalies in streaming data.
Combining all the above services, we get below architecture. Let us go through a step-by-step approach to realise this architecture.
Step 1: Configuring the Raspberry Pi simulator
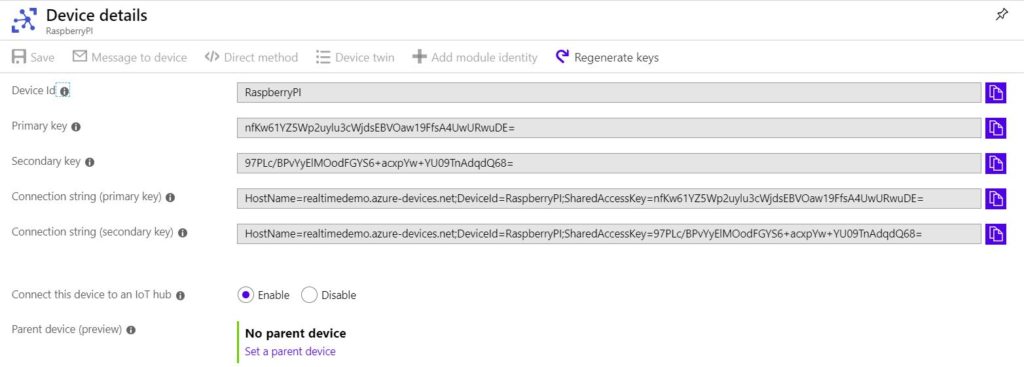
Raspberry Pi is a modern-day microcontroller with rich hardware and firmware support. For the sake of this demo, we will use the online simulator by Microsoft. Here is the link for the same. In order to configure the simulator, we need to declare a device in the IoT hub, which is the simulator in this case. Click on the Add icon and mention the device name.
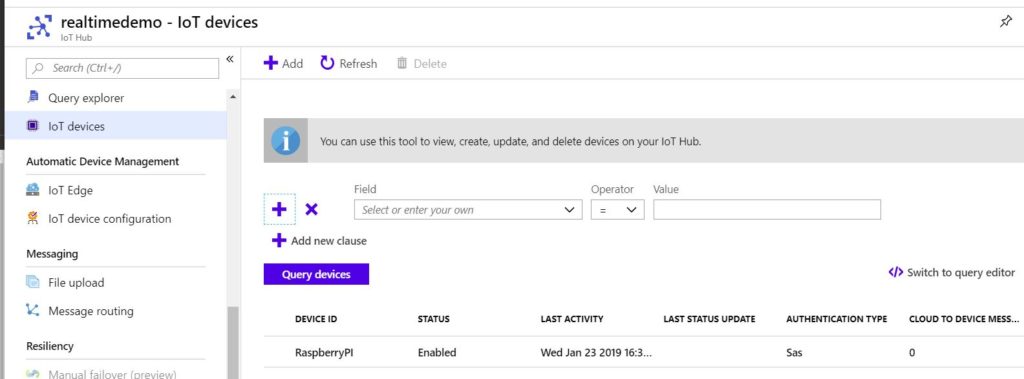
Next, click on the registered device and retrieve the primary connection string from the device details.
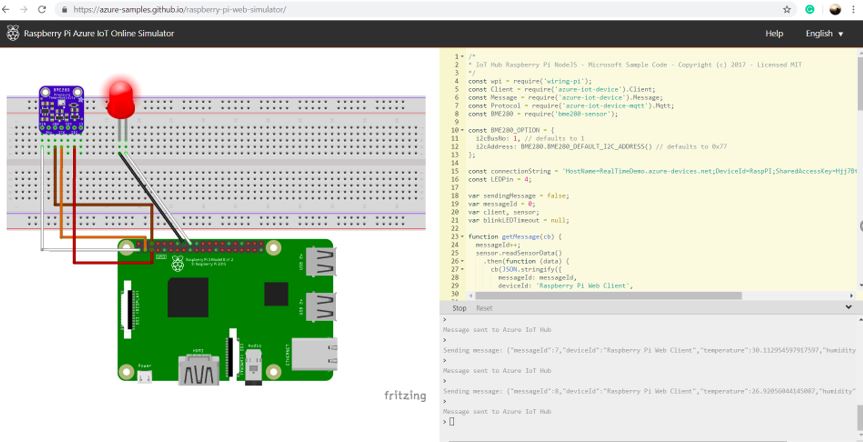
Finally, place the connection string in the connection string field of the Raspberry PI simulator and run the simulator. As a sanity check, make sure that the LED shown in the picture glows.
Step 2: Azure Stream Analytics
Once the Azure IoT hub receives events from the simulator/devices, the former acts as an input to the stream processing engine of Azure viz Azure Stream Analytics, while the latter’s output goes to Azure Cosmos DB and PowerBI, as shown in the architecture diagram above. Let’s traverse through the following steps.
Azure Stream Analytics Job topology
Follow this tutorial to create an Azure Stream Analytics job. Once created, go to job topology in the sidebar.
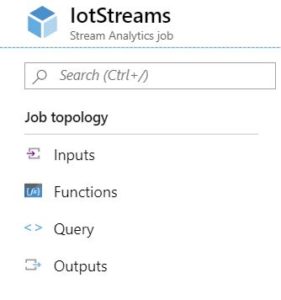
A stream analytics job is essentially a SQL code. It has four components.
- Inputs: The Inputs help us define and configure our input.
- Functions: Functions are used to define a function to be used in the SQL statement. We will use the Azure Machine Learning Web service as a function in order to score the streaming data to find anomalies.
- Query: Query is the central component, where you define the SQL code in order to manipulate the streaming data from the Inputs and send it to the Outputs, with the help of functions and SQL constructs.
- Outputs: Here we define the Outputs to Stream Analytics namely Azure Cosmos DB and Power BI.
Defining Inputs
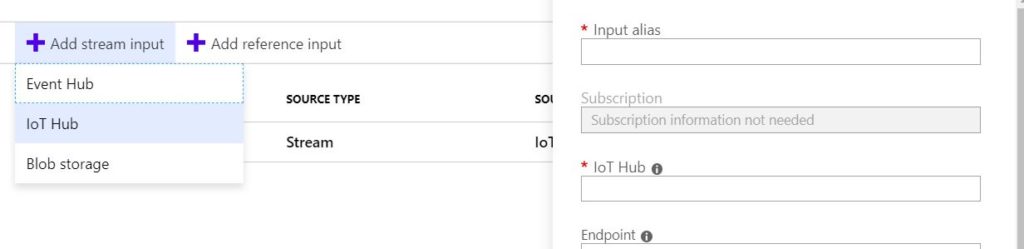
Our source for this demo is the Azure IoT hub. We will define an IoT hub input named IotSource. Go to the Inputs in the sidebar and click on ‘Add Stream Input’ and select IoT hub and type IotSource as the Input alias. Follow the tutorial, Stream data from IoT Hub, in order to configure the IoT hub as an Input to stream analytics.
Defining Outputs
In this scenario, we will use two sinks: viz PowerBI and Azure Cosmos db. The former is used to visualize streaming data in real-time, while the latter is used to store and analyze the streaming events. The stored events will then train an anomaly detection model in Azure Machine Learning Studio. It will then expose the anomaly detection model as a web service to be leveraged by Azure Stream Analytics as a function, in order to detect anomalies (to be visualized in Power BI) in streaming data. This forms a feedback loop as shown in the architecture above
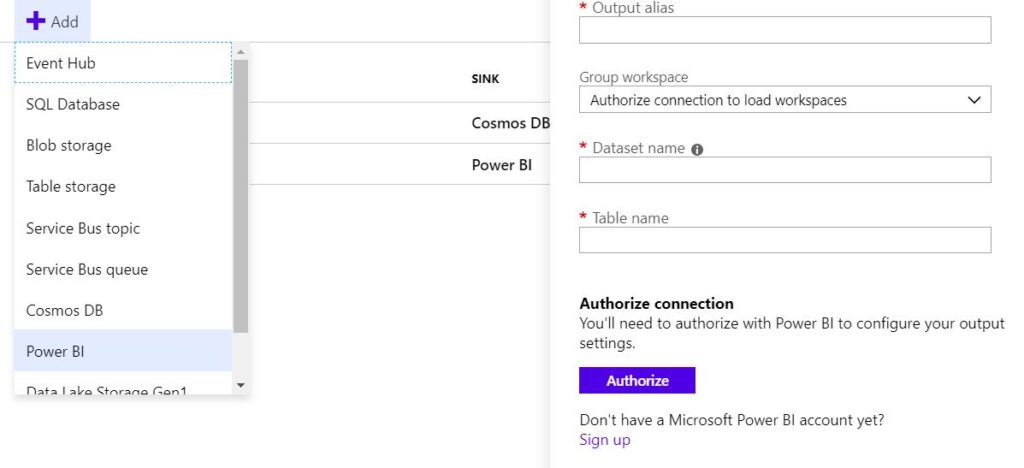
In the Outputs section, click on ‘Add’ and select Power BI. Use Powerbi as output alias. Use Stream as Dataset name and withAnomaly as Table name. Stream analytics automatically creates the Dataset and Table in your Power BI workspace. However, it needs permission to do so. Hence, click on Authorize in order to authenticate stream analytics to access your Power BI workspace. Power BI uses the O365 account to manage identities.
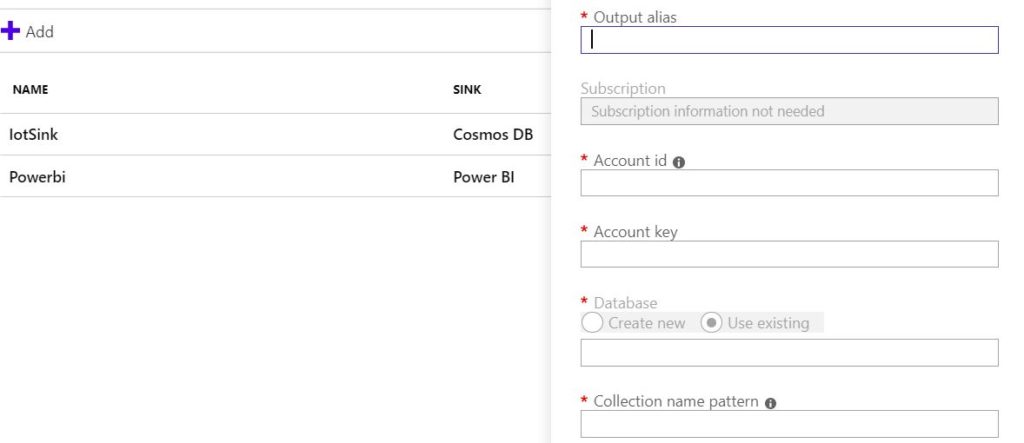
Create the second sink viz. Azure Cosmos DB by following this document. After creating Cosmos db, define the second output with the alias IotSink. Follow this comprehensive document to configure this output: Azure Stream Analytics output to Azure Cosmos DB
Defining Query
Click on Query in order to define the SQL queries for stream processing.
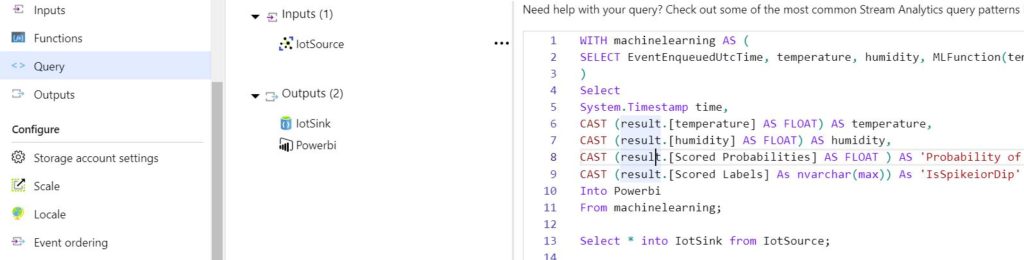
Since we have two outputs, we need to define two queries. One of them will dump the incoming data into the cosmos db. Below is the simple query which will achieve the same.
Select * into IotSink from IotSource;
The other query transforms the incoming data along with scoring it with a Machine Learning Function. Here is the full query:
WITH machinelearning AS (

SELECT EventEnqueuedUtcTime, temperature, humidity, MLFunction(temperature, humidity) as result from IotSource

)

Select

System.Timestamp time,

CAST(result.[temperature] ASFLOAT)AS temperature,

CAST(result.[humidity] ASFLOAT)AS humidity,

CAST (result.[Scored Probabilities] AS FLOAT ) AS 'Probability of spike or dip',

CAST(result.[Scored Labels] As nvarchar(max))As'IsSpikeiorDip'

Into Powerbi

From machinelearning;
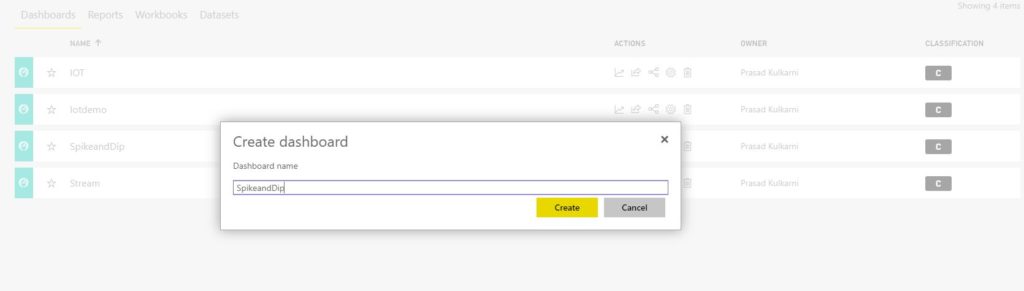
Paste both the queries in the query editor and run the stream analytics job. After this, open the Power BI service and create a dashboard named SpikeandDip.
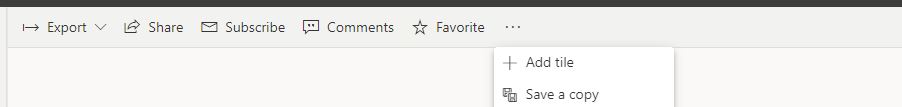
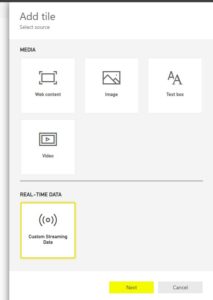
In the dashboard pane, add a tile.
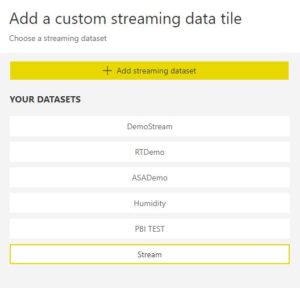
Select a custom streaming dataset.
In the next window, you see that the dataset Stream defined in the Power BI output of Azure Stream Analytics exists beforehand.
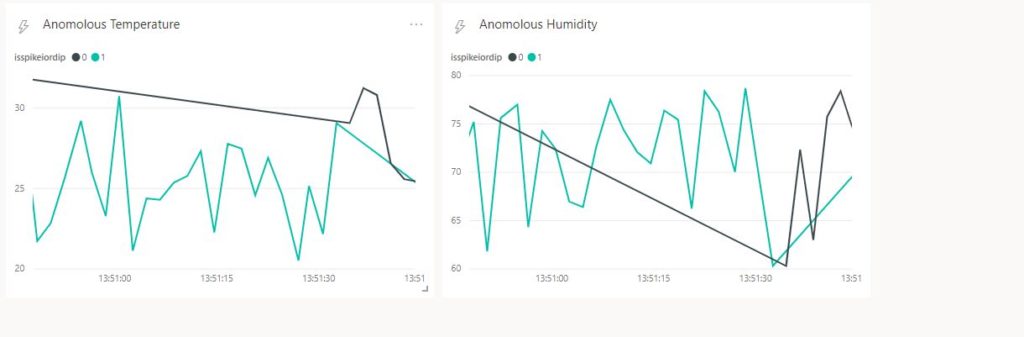
Finally, create a line chart that shows temperature values over time along with the legend isspikeordip, in order to detect a spike or dip i.e. an anomalous record. The below image shows the final dashboard displaying both normal and anomalous values of temperature and humidity.
Defining ML function
This article on Azure IoT would be incomplete without defining the ML Function, which receives the temperature and humidity values as inputs and returns the degree of the anomaly and the categorical statement of the same.
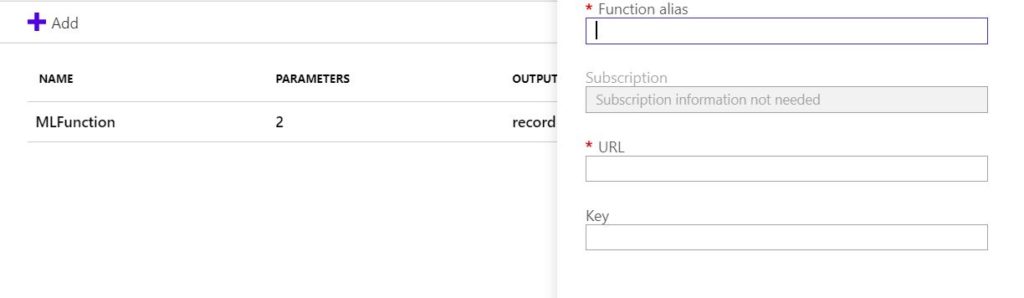
In the Functions tab, go to ‘Add’ and select the Azure ML option. Next, use MLFunction as the function alias. Use the Request/Response URL of the ML model exposed as a web service along with the API key. The next section elucidates more on this.
Step 3: Creating the Azure Machine Learning anomaly detection model.
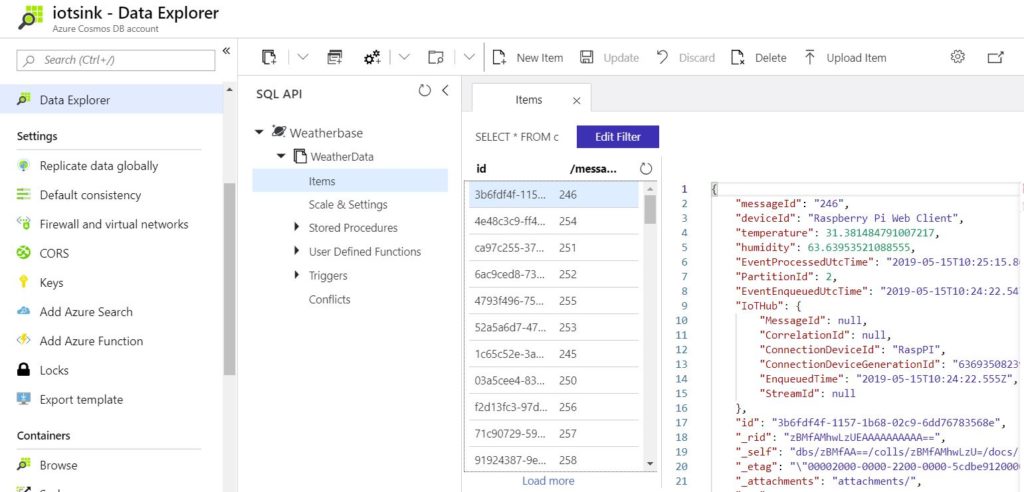
The CosmosDB in the architecture serves the purpose of storing historical data about the events. Above all, it can train an anomaly detection machine learning model. The below snapshot shows the data explorer of the CosmosDB. Now, let us build an Anomaly detection model with this historical data.
If you are a beginner with Azure ML studio, here is an exhaustive tutorial for the same: Quickstart: Create your first data science experiment in Azure Machine Learning Studio.
In order to access the Cosmos db data from the Azure ML Studio, we use the ‘Import Data’ module. The following properties need to be set.
- Data source: Azure Cosmos DB
- Endpoint URL: Available in Azure Cosmos DB overview pane.
- Database ID: Name of the database used to store the events.
- Azure Cosmos DB Key: The primary or secondary key from the keys pane in the sidebar.
- Collection ID: The collection in which we store the events.
- SQL query: The SQL query used to fetch the source data. Please note that SQL API for cosmos db is case sensitive, unlike TSQL.
Here is an example of a SQL query. Note that WeatherData is our Collection ID.
SELECT * From WeatherData
This is how the complete training experiment looks like.
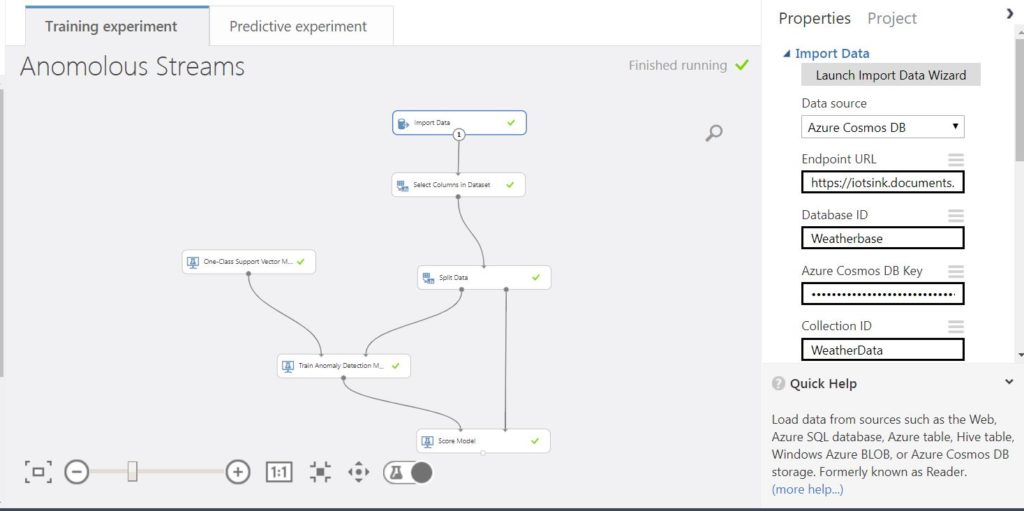
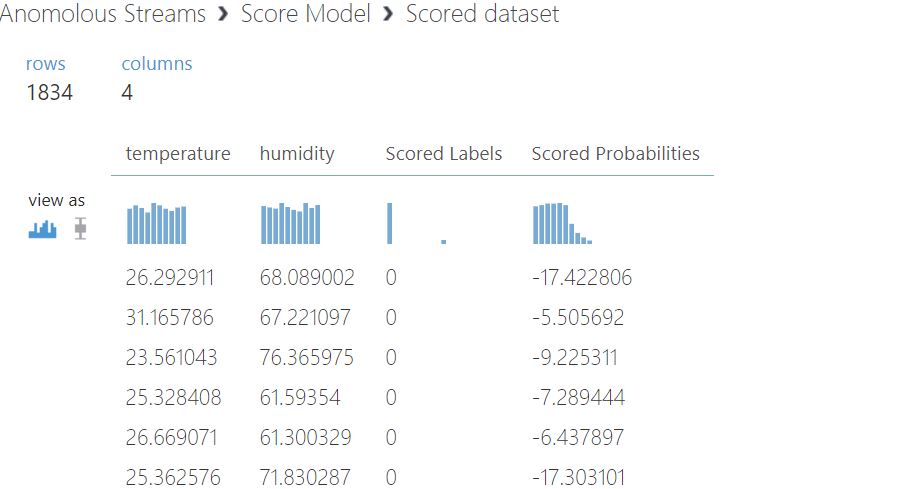
In the second module, i.e. ‘Select Columns in Dataset’, select temperature and humidity. Further, we split the data into training and test set. The training set is used to train the Anomaly detection model with one class support vector machine. The test set is used to score the model. Please note that the probabilities in the scored result aren’t probabilities in the literal sense, but kernel density estimates.
The scored results are:
Step 4: Deploying Azure Machine Learning anomaly detection model.
Once the model is trained, create a predictive experiment. For reference, use: Tutorial 3: Deploy credit risk model – Azure Machine Learning Studio. The below pic depicts the predictive model. Please note that it originally connected the web service input to Select Columns in the Dataset module. This will create a predictive model which receives all the inputs of the source. In order to receive only two values viz. Temperature and humidity, connect the web service input to the Score model.
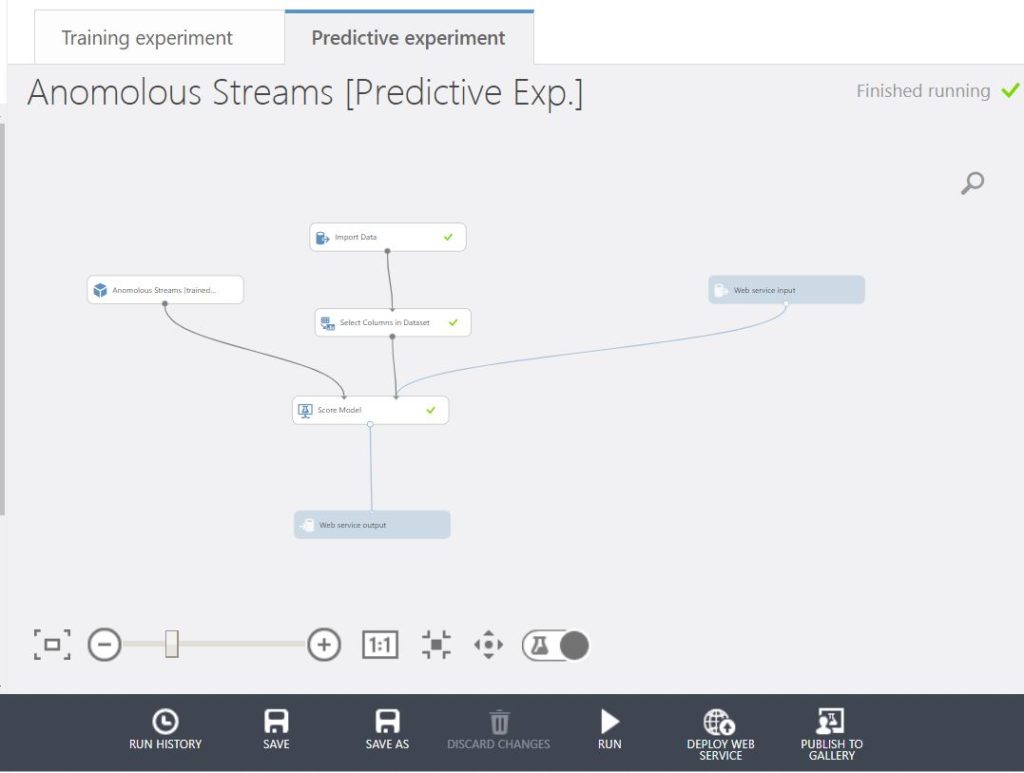
Once ready, run the predictive experiment and deploy the web service. Post that, retrieve the API key and the request-response URL.
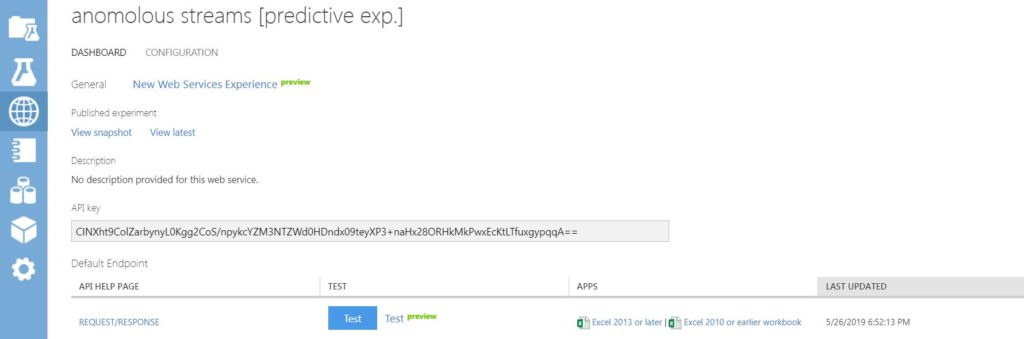
Use the API key and request-response URL in the Azure Stream Analytics MLfunction defined above. After this step, you are all set to go!
Concluding Notes:
- For event processing, we can use other services like Azure Databricks. Read this article to know more: Azure Databricks tutorial: an end to end analytics.
- For Anomaly detection, Azure Stream Analytics has a built-in feature in preview: Anomaly detection in Azure Stream Analytics.
- Azure IoT is not restricted to these components. Messaging services like Kafka, stores like Azure SQL DB, stream processing engines like storm are also available. We encourage you to explore them as well.
- Finally, this is a high-level IoT system design on Azure. We did not tune the Anomaly detection algorithm.
Disclaimer: The articles and code snippets on data4v are for general information only. We make no representations or warranties of any kind, express or implied, about the completeness, accuracy, reliability, suitability or availability regarding the website or the information, products, services, or related graphics contained on the website for any purpose.